Guide · Site analysis
Site analysis for architects: what to map, and how to get the maps in minutes.
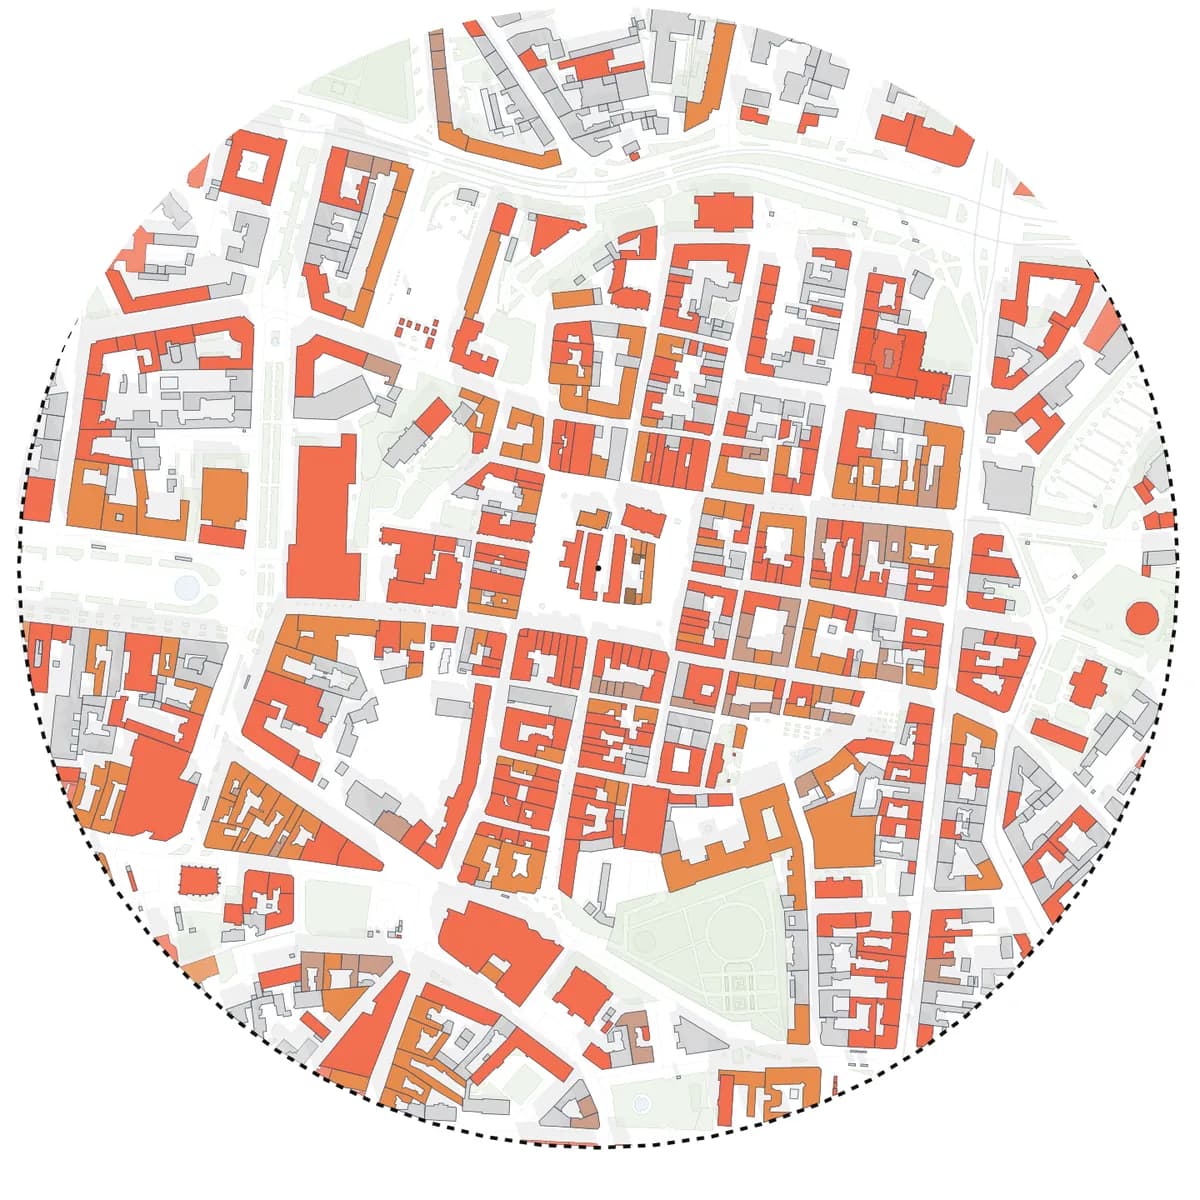
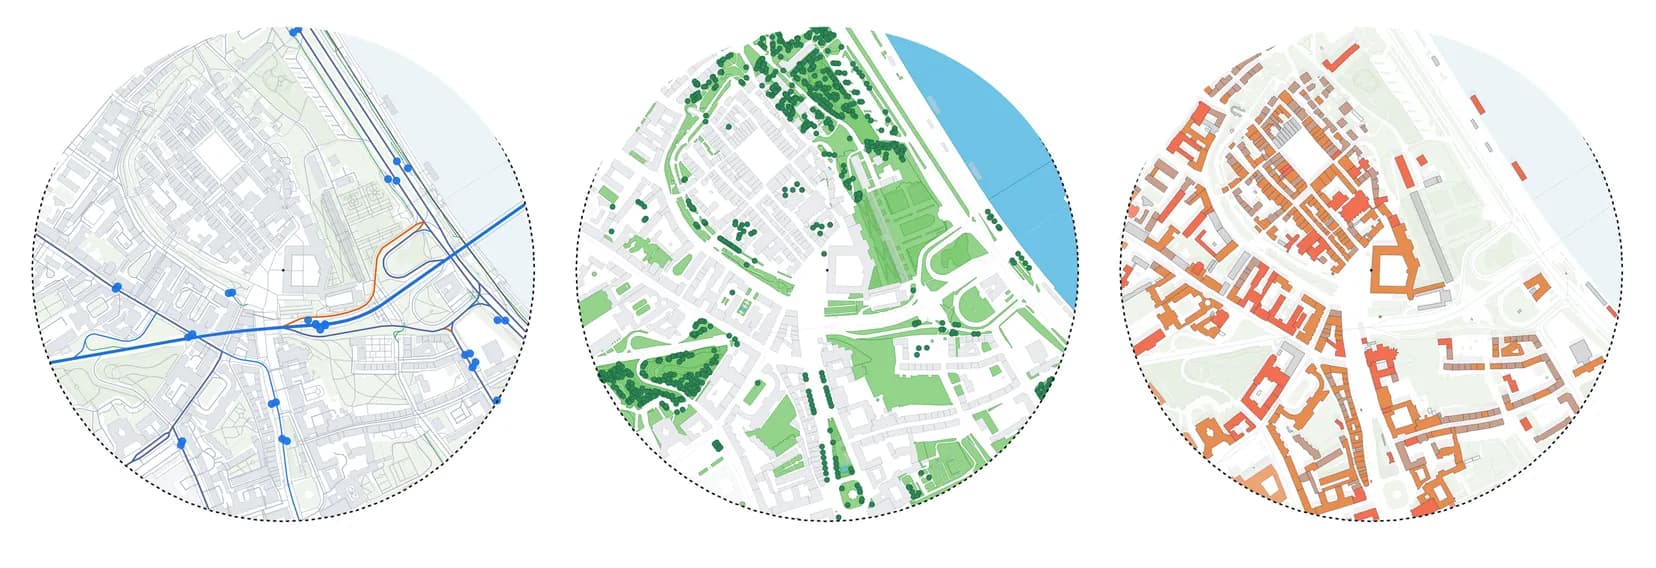
A site analysis answers a short list of questions before design starts: what surrounds the plot, how people reach it, where the sun and the greenery are, what the neighbouring buildings are used for and what the rules allow. This checklist goes through each map, says where the data comes from in Europe and shows which maps Gridded makes from one generated study area.
- context, access, greenery, building use and sun from one study area
- any address in 50 European countries; Polish sites add parcels, terrain and zoning
- 2D maps, 3D massing and vector PDF sheets from the same project
The checklist
Eight questions every site analysis should answer
Use them as the table of contents of your analysis board. Not every project needs all eight, but leaving one out should be a decision, not an accident.
- Context: what are the grain, block size and building scale around the plot?
- Access: which streets, cycle routes and public transport stops serve it?
- Greenery and water: which parks, trees and water are within a short walk?
- Use: what do the surrounding buildings hold: housing, offices, shops, schools?
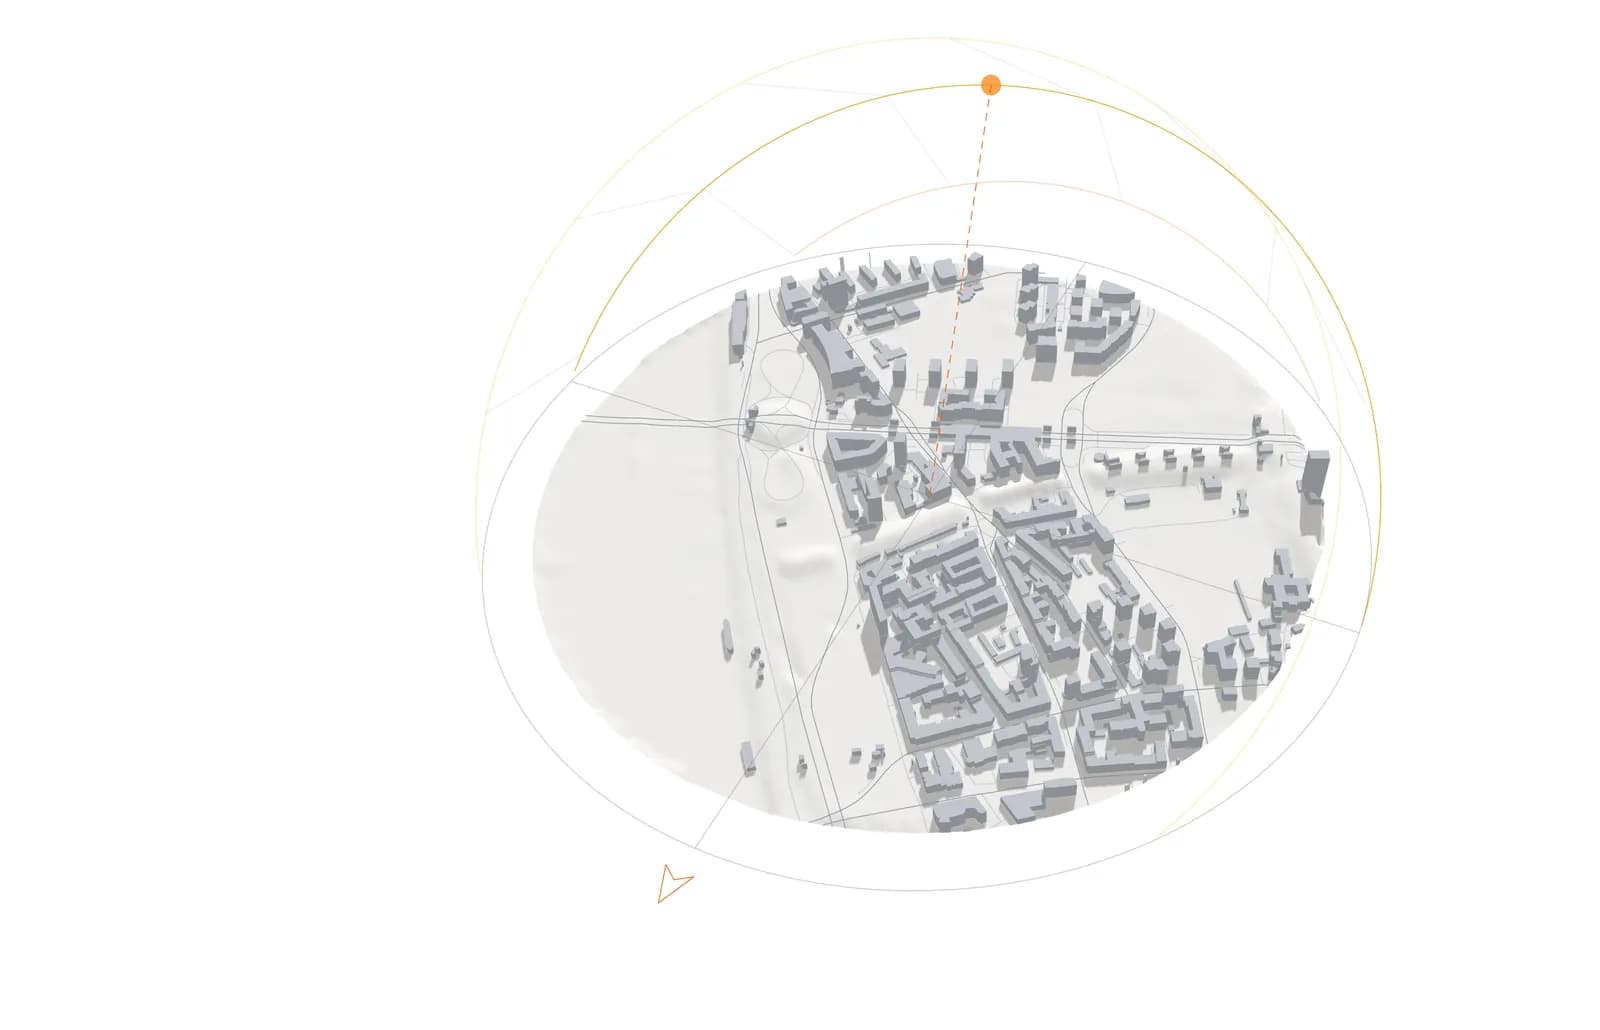
- Sun and shadow: which parts of the plot get sun, and which neighbours shade it?
- Topography: how much does the ground fall across the site?
- Rules: what do the local plan and the building code allow?
- Views, noise and character: what you only learn by visiting the site
Where the data comes from
Open data covers most of it, official data the rest
Across Europe, OpenStreetMap is the common source for buildings, streets, transport and green space, and it is detailed in most cities. Terrain, cadastral parcels and planning rules come from national agencies, in a different format in every country. Gridded uses OpenStreetMap everywhere and, for Polish sites, also the official cadastre, terrain model, zoning plans, flood and noise maps.
- OpenStreetMap: buildings, building use, roads, rail, stops, greenery, water
- official data (Poland today): parcels, terrain, zoning, flood, noise
- site visit: views, noise, character and everything no map shows
Sun and 3D
Check sun and massing on the same model
Building heights come from OpenStreetMap height and storey tags, with a typical height where tags are missing; Polish sites use the national surface model instead. The sun study runs on the site's own time zone, so 9:00 on 21 June in Lisbon is 9:00 in Lisbon, not on your laptop's clock.
Present it
Turn the maps into one board
Keep one preset per question, the same study area and the same scale in every map, and export each one as a PDF sheet. Consistent framing makes the board read as one analysis rather than a collection of screenshots.
- one study area for every map
- one preset per question, saved in the project
- the same scale and sheet size for every export
Workflow
A site analysis in five steps with Gridded
The same five steps work for a studio brief, a competition or a feasibility study.
Find the site
Search an address or a landmark. The app checks straight away whether the area is covered.
Set the study area
A 400 m radius, about a five-minute walk, costs two tokens. Bigger areas cost four or eight.
Generate once
All layers arrive together, so every map that follows shows exactly the same buildings and streets.
Go through the presets
Site Plan, Building Analysis, Functional Analysis, Transport Analysis, Greenery & Water, Sun Analysis and the 3D view. Polish sites also get parcel, terrain, zoning, flood and noise presets.
Export and assemble
Vector PDF sheets on the Free plan; DXF and SVG on the Student and Solo plans for further work in CAD or Illustrator.
What you get
What one project gives you
One generation covers most of the checklist. The rest is the site visit.
- context, access, greenery and building use maps of one area
- 3D massing of the surroundings with sun and shadow for any date
- a vector PDF sheet per map, framed and scaled the same way
- for Polish sites: parcels, terrain, zoning plans, flood and noise maps
Comparison
Gridded vs collecting the maps by hand
The questions do not change. What changes is how long each map takes and whether the maps match each other.
| Criterion | Gridded | By hand |
|---|---|---|
| Base map | Generated from an address | Traced or downloaded, then cleaned |
| Each further map | Switch a preset | Restyle or redraw |
| Sun study | Built in, on the site's time zone | A separate tool and model |
| Consistency | Same area, scale and data in every map | Depends on discipline |
| Price | Free plan with 5 tokens a month | Your time |
Frequently asked questions
What should an architectural site analysis include?
At least context, access, greenery, building use and sun, plus topography and planning rules where they matter, and notes from a site visit. The checklist above is a good table of contents for the board.
Is Gridded suitable for architecture students?
The Free plan gives 5 tokens every month. A study area up to 0.25 km² costs one token, up to 1 km² two tokens, and the largest area (about a 2 km radius) eight. Styling, presets, the 3D view and the sun study never cost extra. Free exports are vector PDF sheets with a small watermark. DXF, SVG and GeoJSON come with the Student and Solo plans, which open when the current free test period ends.
Which countries are covered?
Poland and the rest of Europe: 50 countries and territories, from Portugal and Ireland to Finland and Greece. Everywhere you get buildings, building use, roads, rail, public transport, water and greenery from OpenStreetMap, the 3D view and the sun study. Polish sites also use official national data: cadastral parcels, terrain, zoning plans, flood and noise maps, and building heights from the national surface model. The app tells you straight away whether a picked area is covered.
Does this replace a site visit?
No. Maps show structure, not atmosphere. Use Gridded to prepare the visit and to draw up what you found, not instead of it.
Related pages
A figure-ground map of any European site, from an address, in a few minutes.
A figure-ground plan (a Schwarzplan in German studios, a Nolli map after the 1748 plan of Rome) is usually the first drawing of a site study: buildings as solid, everything else as void. Most architects still make one by loading OpenStreetMap data into QGIS, buying a ready-made city plan or tracing an aerial photo. Gridded builds it from an address in 50 European countries, keeps it editable and lets you read the same block structure in 2D, in 3D and on a vector PDF sheet.
A 3D model of the site's surroundings, from an address, in your browser.
Before a massing study you need the neighbours: how tall they are, how close they stand and what shadow they cast. Gridded builds a 3D context model from the same data as its 2D maps, so the site plan, the massing and the sun study always show the same buildings. It works for any address in 50 European countries.
OpenStreetMap to DXF: four ways to get a clean CAD base map of a European site.
OpenStreetMap is the most complete free source of buildings and streets in Europe, but it does not arrive as a drawing. This guide compares the common routes from OpenStreetMap to a layered DXF (QGIS, a converter script, a CAD plug-in and an online generator) and shows where Gridded fits: generate the site once, style it, then export the same project as PDF, DXF or SVG.