Guide · Figure-ground
A figure-ground map of any European site, from an address, in a few minutes.
A figure-ground plan (a Schwarzplan in German studios, a Nolli map after the 1748 plan of Rome) is usually the first drawing of a site study: buildings as solid, everything else as void. Most architects still make one by loading OpenStreetMap data into QGIS, buying a ready-made city plan or tracing an aerial photo. Gridded builds it from an address in 50 European countries, keeps it editable and lets you read the same block structure in 2D, in 3D and on a vector PDF sheet.
- type an address, pick a circle or square study area and generate it once
- switch to the Figure-ground look: buildings in the study area turn solid black, the surrounding fabric stays grey
- export a vector PDF sheet fitted to the page or at a scale from 1:500 to 1:5000
What it is
What a figure-ground map shows and when you need one
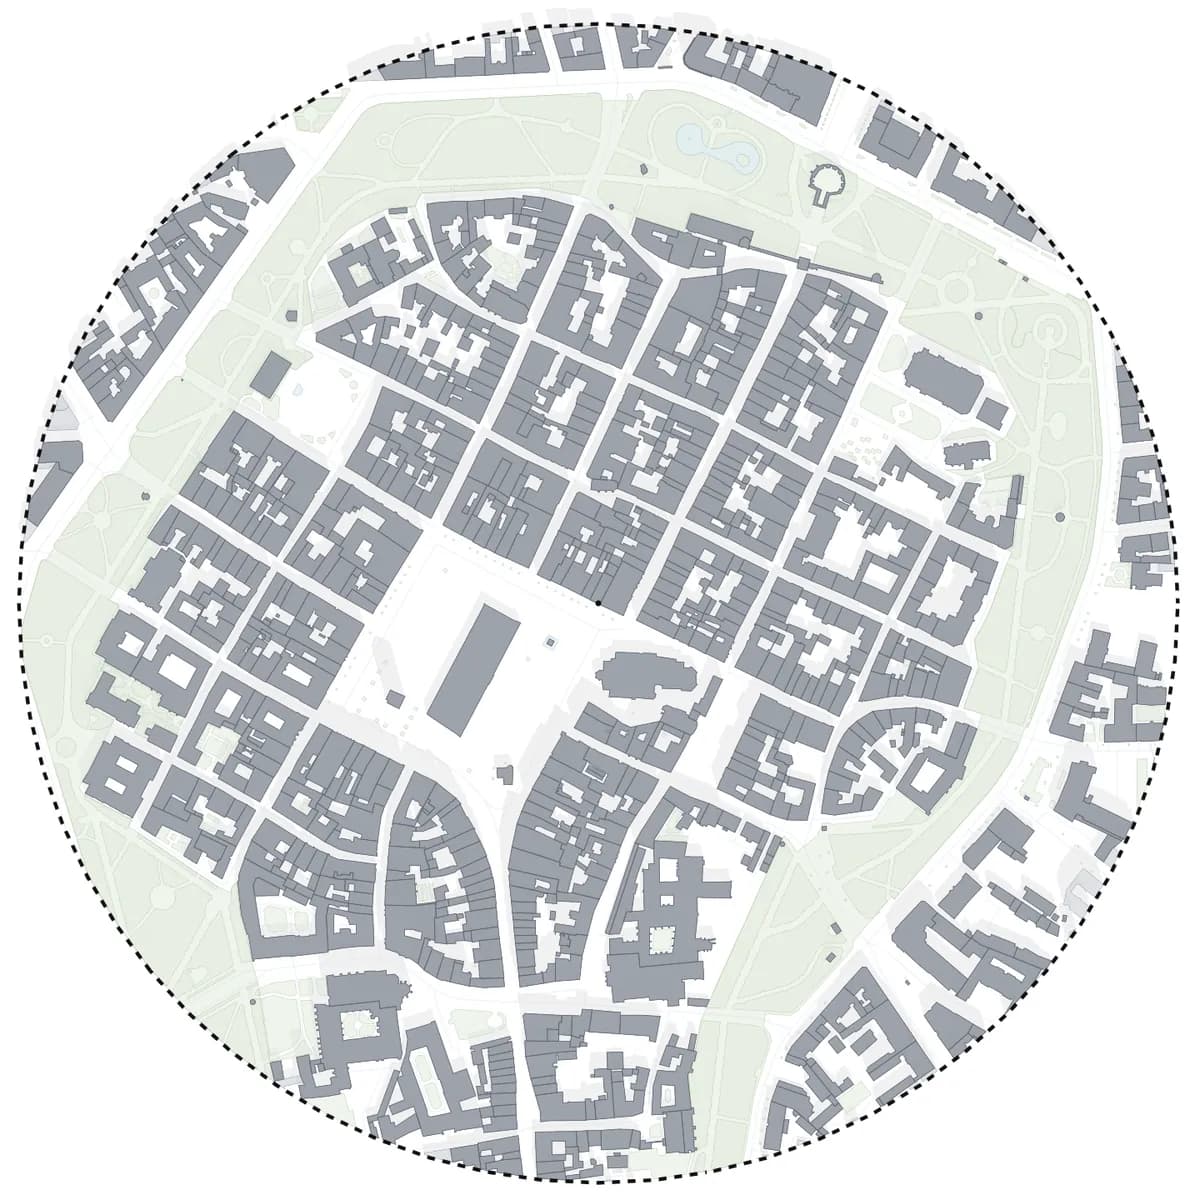
A figure-ground map strips a place down to two values: built and unbuilt. That is enough to read grain, block size, street rhythm and the open spaces a new building will sit next to. It is the base for competition boards, studio site analyses, urban design reports and the first conversation with a client about scale.
- block structure and plot grain at a glance
- squares, streets and courtyards as clear voids
- a neutral base for every later diagram: access, greenery, sun, building use
The usual routes
Three common ways to make one, and where they cost time
Ready-made city plans are quick, but their extent and style are fixed and rarely match your study area. The QGIS route is free and precise, but every new site means downloading OpenStreetMap data, filtering buildings, choosing a projection, styling and setting up a print layout. Tracing an aerial photo is the slowest route and the least accurate one at the edges.
- buying a plan: fast, but a fixed extent and one style
- QGIS and OpenStreetMap: free, but a set-up you repeat for every site
- tracing: hours of drawing and guesswork where trees hide the roofs
How Gridded does it
One generated study area, then any number of looks
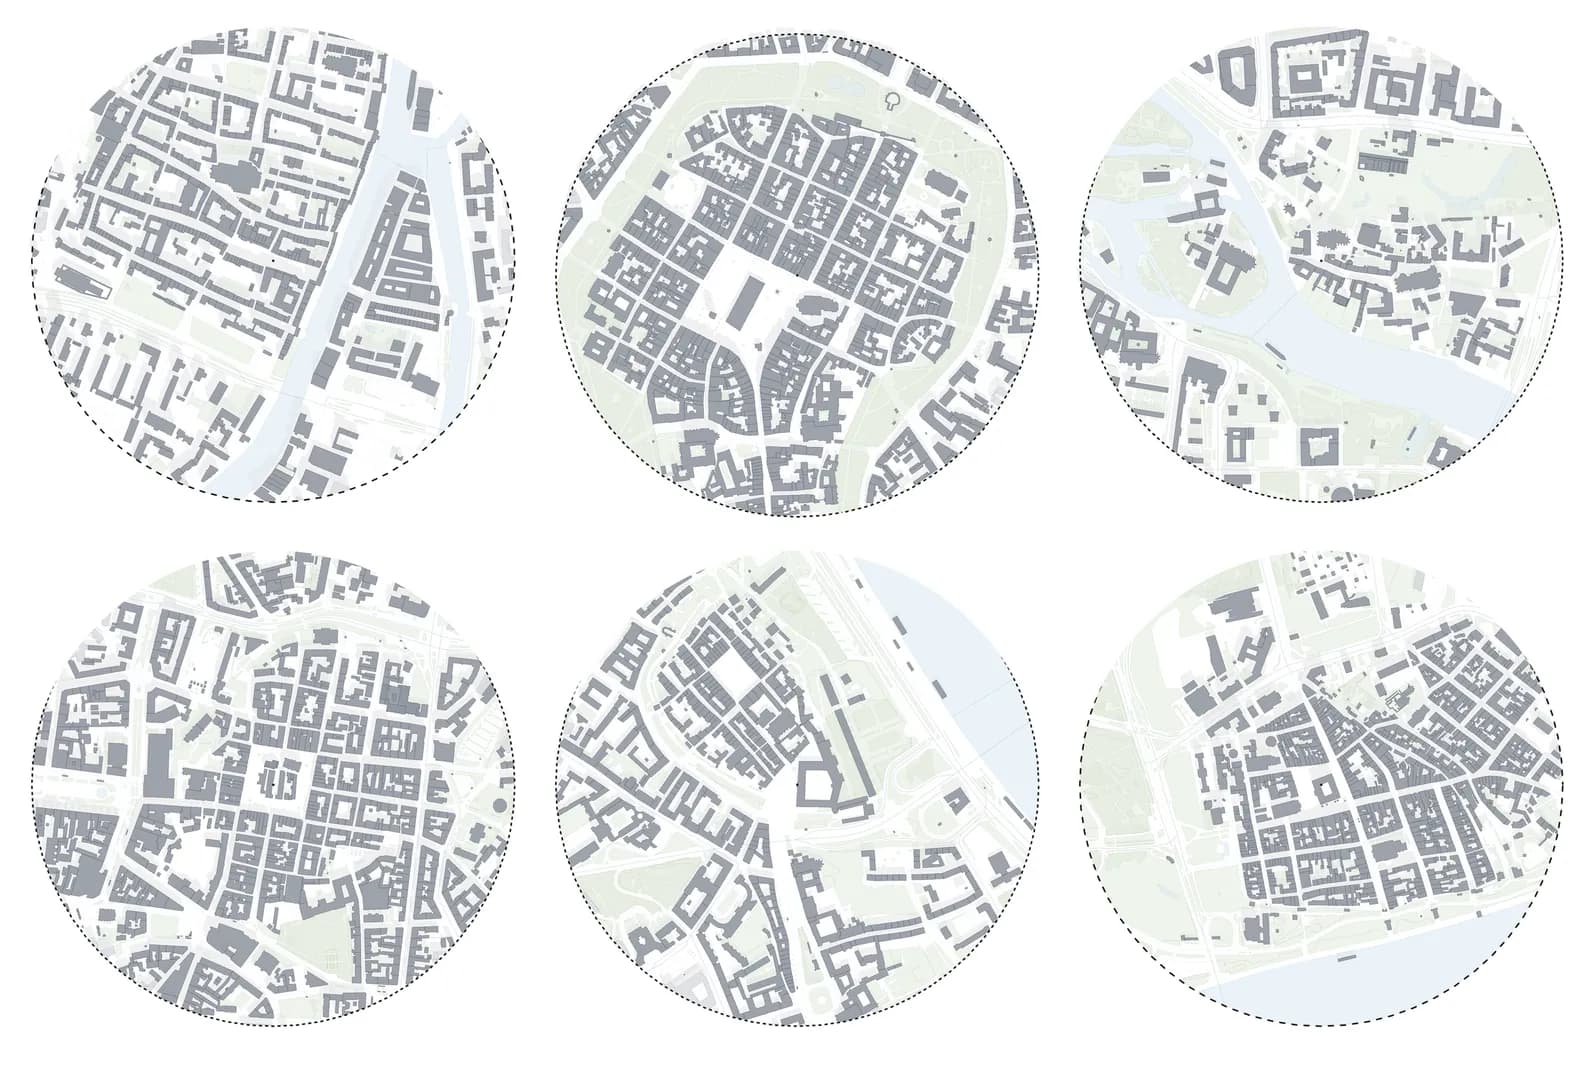
Gridded fetches buildings, roads, rail, water and greenery for the area you pick and keeps them as separate layers. The Figure-ground look in the Looks tab turns buildings inside the study area black and the surrounding context light grey; the Building Analysis preset keeps a softer grey version for boards. Restyling never costs another token, so you can try several readings of the same site.
Beyond black and white
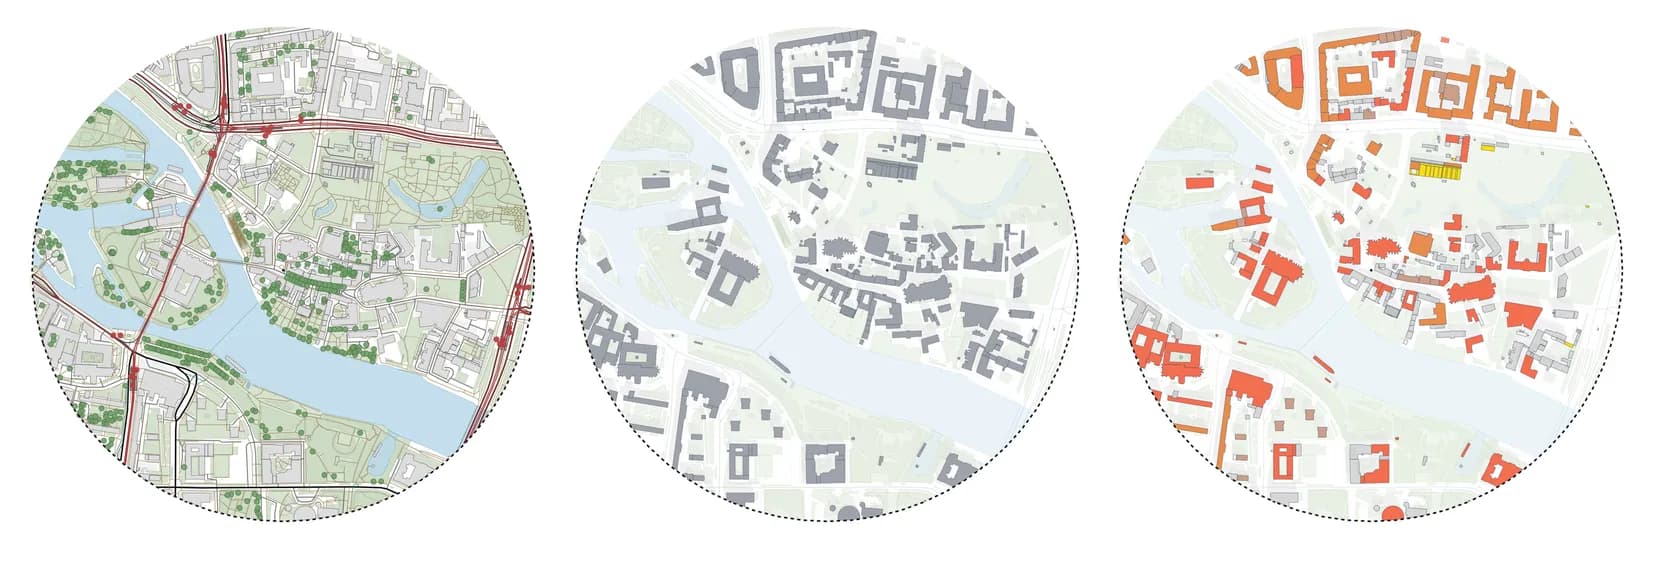
Read the same block structure three ways
Once the base exists, one click switches it to a site plan with streets, greenery and transport, or to a functional analysis that colours buildings by use from OpenStreetMap tags. The figure-ground stays the reference drawing; the other views explain it.
Workflow
From an address to a figure-ground sheet in five steps
Everything happens in the browser. There is nothing to install and no GIS project to maintain.
Search the address or drop a pin
Any address, square or landmark in the 50 covered European countries. The app tells you at once if an area is outside coverage.
Set the study area
A circle or a square. Up to 0.25 km² costs one token, up to 1 km² two tokens; the largest area, about a 2 km radius, costs eight.
Generate once
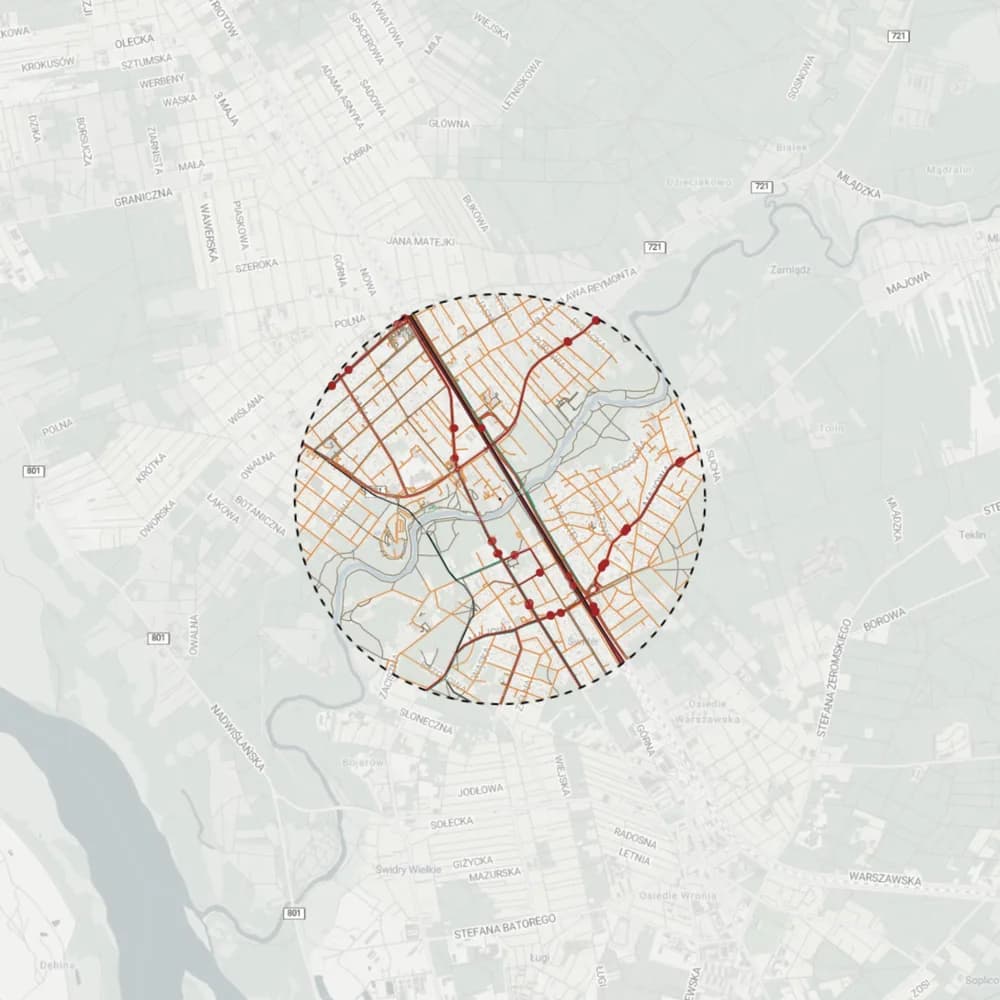
Buildings, roads, rail, water, greenery and trees arrive as separate layers, usually in under a minute.
Apply the Figure-ground look
Open the Looks tab and pick Figure-ground. Hide trees or transport stops, change the grey of the context, or draw a building that is not in the data yet.
Export the sheet
A vector PDF from A4 to A1, fitted to the page or at a fixed scale, with a title block, legend and scale. DXF and SVG for CAD and Illustrator are part of the Student and Solo plans.
What you get
What one project gives you
The figure-ground is the start. The same project keeps producing material for the rest of the site study.
- a figure-ground map of the study area and its surroundings
- site plan, building use and transport views of the same block structure
- a 3D massing view of the surroundings for scale and shadow checks
- a vector PDF sheet at scale, ready for a board or a crit
Comparison
Gridded vs the QGIS route
QGIS is excellent and free. The difference is how much of the work you repeat for every new site.
| Criterion | Gridded | QGIS + OpenStreetMap |
|---|---|---|
| Set-up per site | Address, study area, generate | Download, filter, reproject, style, lay out |
| Restyling | Looks and presets, one click | Symbology edited layer by layer |
| 3D and sun study | In the same project | 3D view or plug-ins, set up separately |
| Price | Free plan with 5 tokens a month | Free |
| Exports | Vector PDF on Free; DXF, SVG and GeoJSON on paid plans | Any format QGIS writes |
Frequently asked questions
Is the figure-ground map generator free?
The Free plan gives 5 tokens every month. A study area up to 0.25 km² costs one token, up to 1 km² two tokens, and the largest area (about a 2 km radius) eight. Styling, presets, the 3D view and the sun study never cost extra. Free exports are vector PDF sheets with a small watermark. DXF, SVG and GeoJSON come with the Student and Solo plans, which open when the current free test period ends.
Which countries are covered?
Poland and the rest of Europe: 50 countries and territories, from Portugal and Ireland to Finland and Greece. Everywhere you get buildings, building use, roads, rail, public transport, water and greenery from OpenStreetMap, the 3D view and the sun study. Polish sites also use official national data: cadastral parcels, terrain, zoning plans, flood and noise maps, and building heights from the national surface model. The app tells you straight away whether a picked area is covered.
How accurate are the building footprints?
They come from OpenStreetMap, which is very complete in most European city centres and patchier in some suburbs and villages. Check the result against an aerial photo before a submission, and draw any missing building in the app.
Can I change the colours and line weights?
Yes. Every layer has its own fill and line settings, and you can save the result as your own style to reuse on the next site.
Do I need to credit OpenStreetMap?
Yes. OpenStreetMap data is published under the Open Database License, which requires attribution. Gridded prints the attribution on every export for you.
Related pages
Site analysis for architects: what to map, and how to get the maps in minutes.
A site analysis answers a short list of questions before design starts: what surrounds the plot, how people reach it, where the sun and the greenery are, what the neighbouring buildings are used for and what the rules allow. This checklist goes through each map, says where the data comes from in Europe and shows which maps Gridded makes from one generated study area.
OpenStreetMap to DXF: four ways to get a clean CAD base map of a European site.
OpenStreetMap is the most complete free source of buildings and streets in Europe, but it does not arrive as a drawing. This guide compares the common routes from OpenStreetMap to a layered DXF (QGIS, a converter script, a CAD plug-in and an online generator) and shows where Gridded fits: generate the site once, style it, then export the same project as PDF, DXF or SVG.
A 3D model of the site's surroundings, from an address, in your browser.
Before a massing study you need the neighbours: how tall they are, how close they stand and what shadow they cast. Gridded builds a 3D context model from the same data as its 2D maps, so the site plan, the massing and the sun study always show the same buildings. It works for any address in 50 European countries.