Sun study
Shadow study for architects: test sun and shadow on a real site in minutes.
A shadow study answers simple questions that shape a concept early: which part of the plot gets morning sun, where the neighbours cast shadow in winter, and whether the garden or courtyard will be usable. You do not need a full energy model to answer them. You need the real buildings around the site, a sun position for a chosen date and time, and a clear drawing of the result.
- sun path and building shadows for any date and hour, in the site's own time zone
- the same study area in 2D and 3D, with heights from real data
- shadows and the sun path included in PDF, PNG, DXF and SVG exports
What to test
The dates and hours that tell you the most
Most studies use the two equinoxes and the two solstices, because they show the average day and the two extremes of the year. Within each day, mid-morning, noon and mid-afternoon are usually enough to see how shadows move across the plot.
- 21 March or 23 September: the average day, used by most daylight rules
- 21 June: the highest sun and the shortest shadows
- 21 December: the lowest sun and the longest shadows
- 9:00, 12:00 and 15:00 as a first pass, then the hours that matter for the brief
Reading the diagram
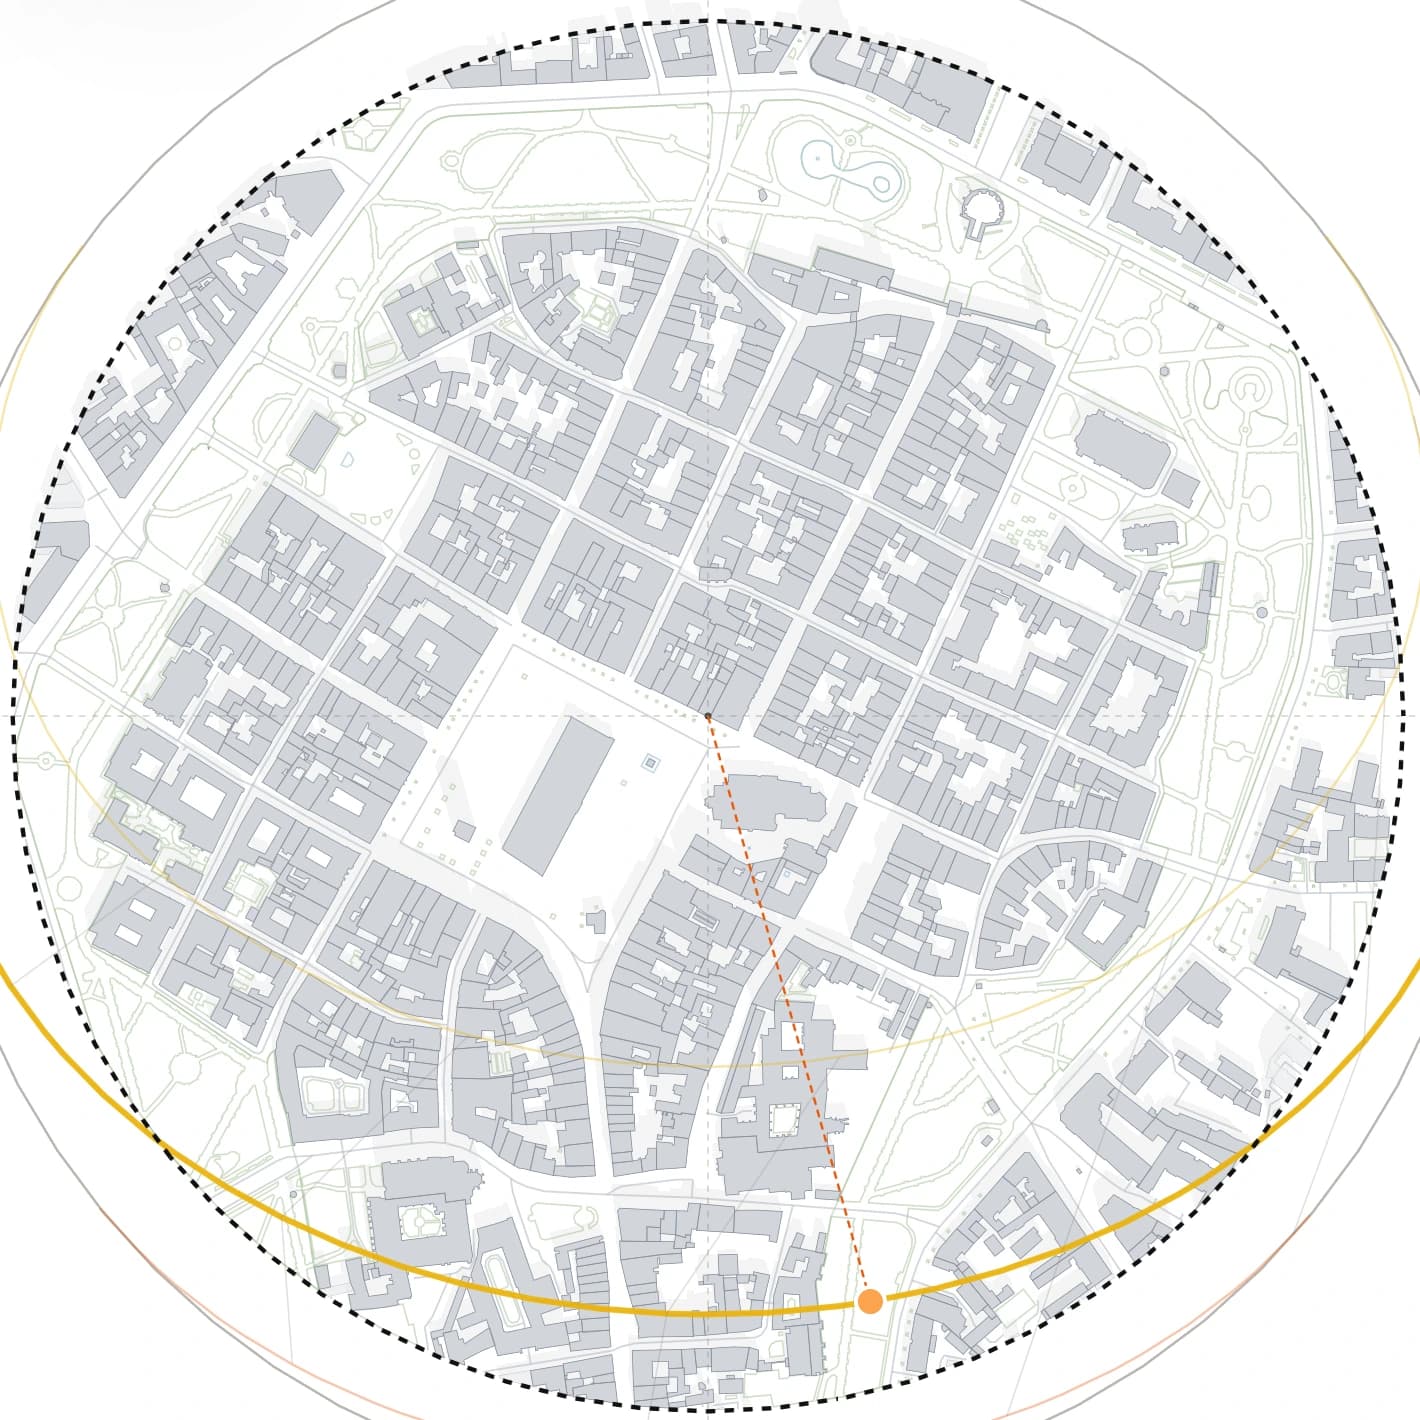
How to read a sun path diagram in plan
In plan, the sun path is the arc the sun travels across the sky on a given day, projected around the site. The marker on the arc is the sun's position at the chosen hour, and shadows fall exactly opposite it. A low arc means a winter day with long shadows; a high, wide arc means summer.
- the arc starts at sunrise and ends at sunset for that date
- shadow length grows as the sun gets lower
- north-facing gaps between buildings stay in shade longest in winter
Rules of thumb
What daylight guidance usually asks for
Rules differ by country, so always check the local regulations for your project. Two common examples: in Poland, living rooms in housing should get at least three hours of sun between 7:00 and 17:00 at the equinoxes. In the UK, BRE guidance suggests that at least half of a garden or amenity space should see two hours of sun on 21 March.
- use a quick study to see early whether a massing option is at risk
- a concept-stage shadow study is not a certified daylight calculation
- keep the date and hour on every exported drawing
Workflow
How to make a shadow study in Gridded
The study runs on the same project as every other analysis of the site, so you do not rebuild the context in a separate tool.
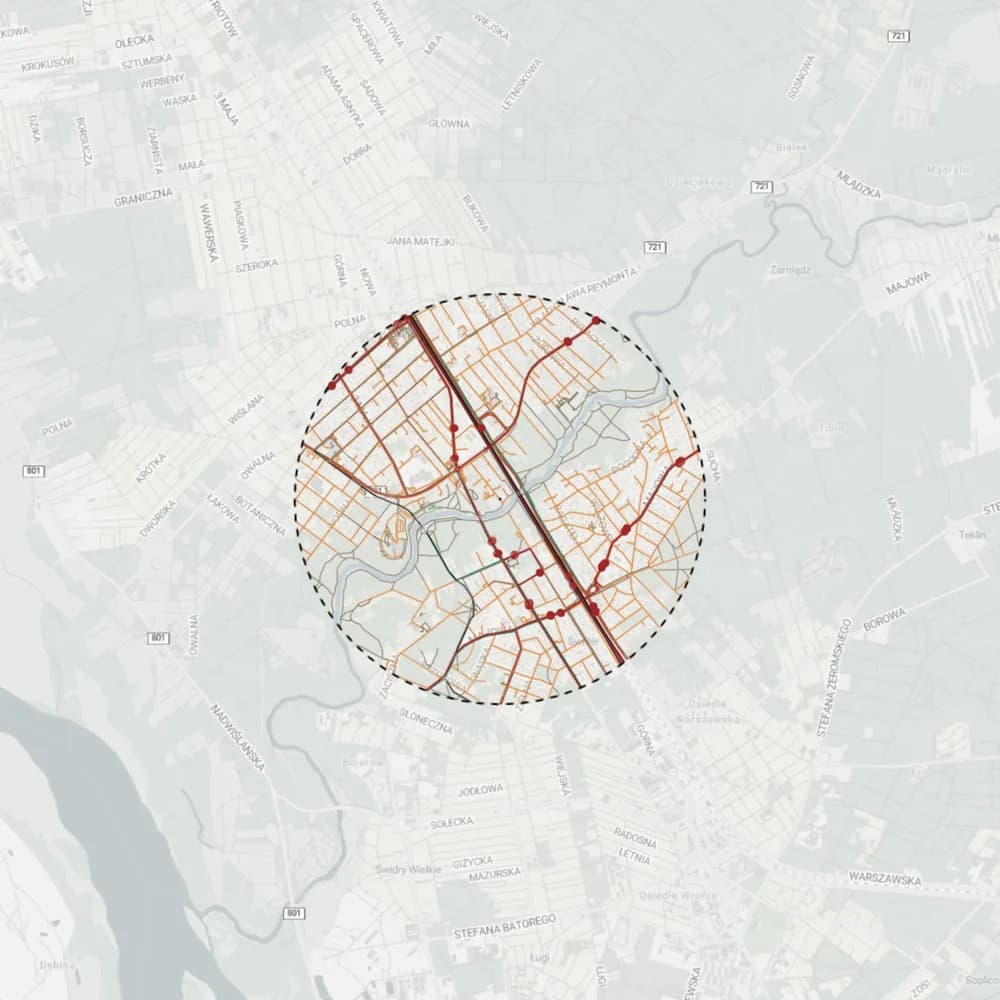
Generate the study area around the site
Pick the location and draw a circle, a square or your own outline. Buildings come in with heights: in Poland from the national surface model, elsewhere in Europe from OpenStreetMap height and level tags.
Choose the date and the hour
Move the day-of-year and time-of-day sliders. The sun position is calculated for the site's coordinates and shown in its local time, so a study of a site in Lisbon reads in Lisbon time.
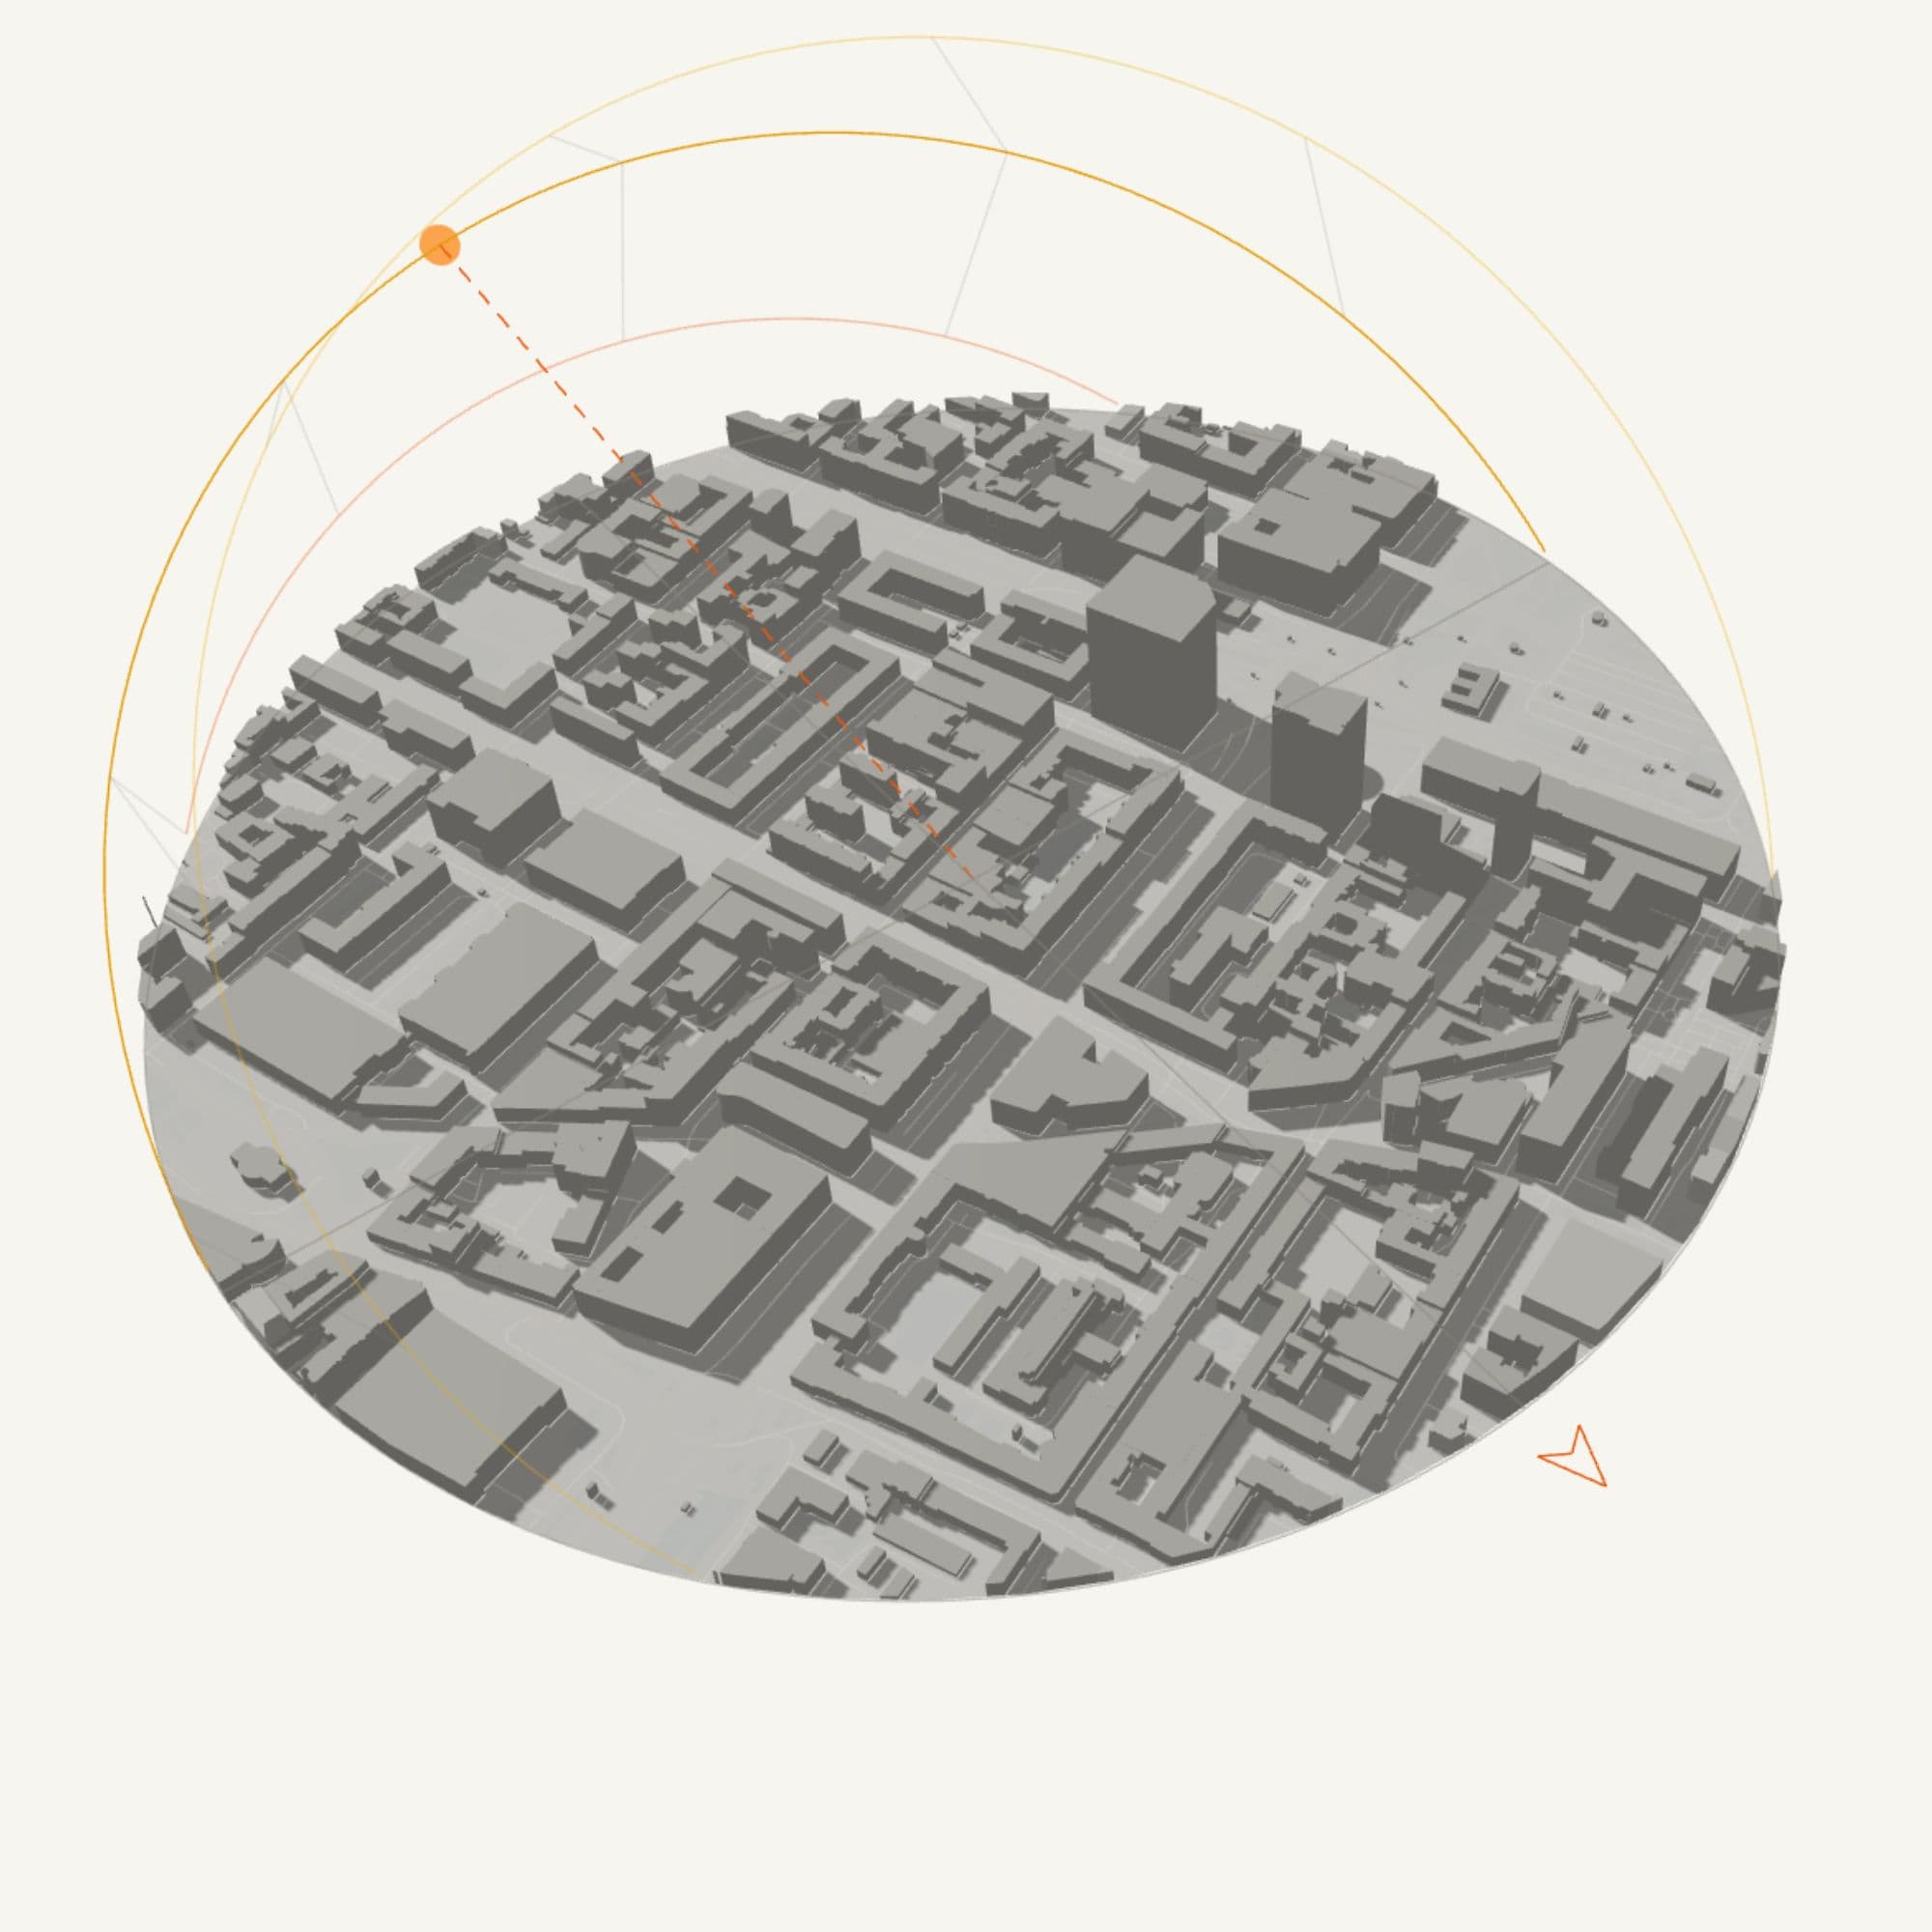
Switch to 3D to check the massing
Orbit around the site to see which facades and open spaces are in shade. This is the quickest way to explain a shadow problem to a client who does not read plans.
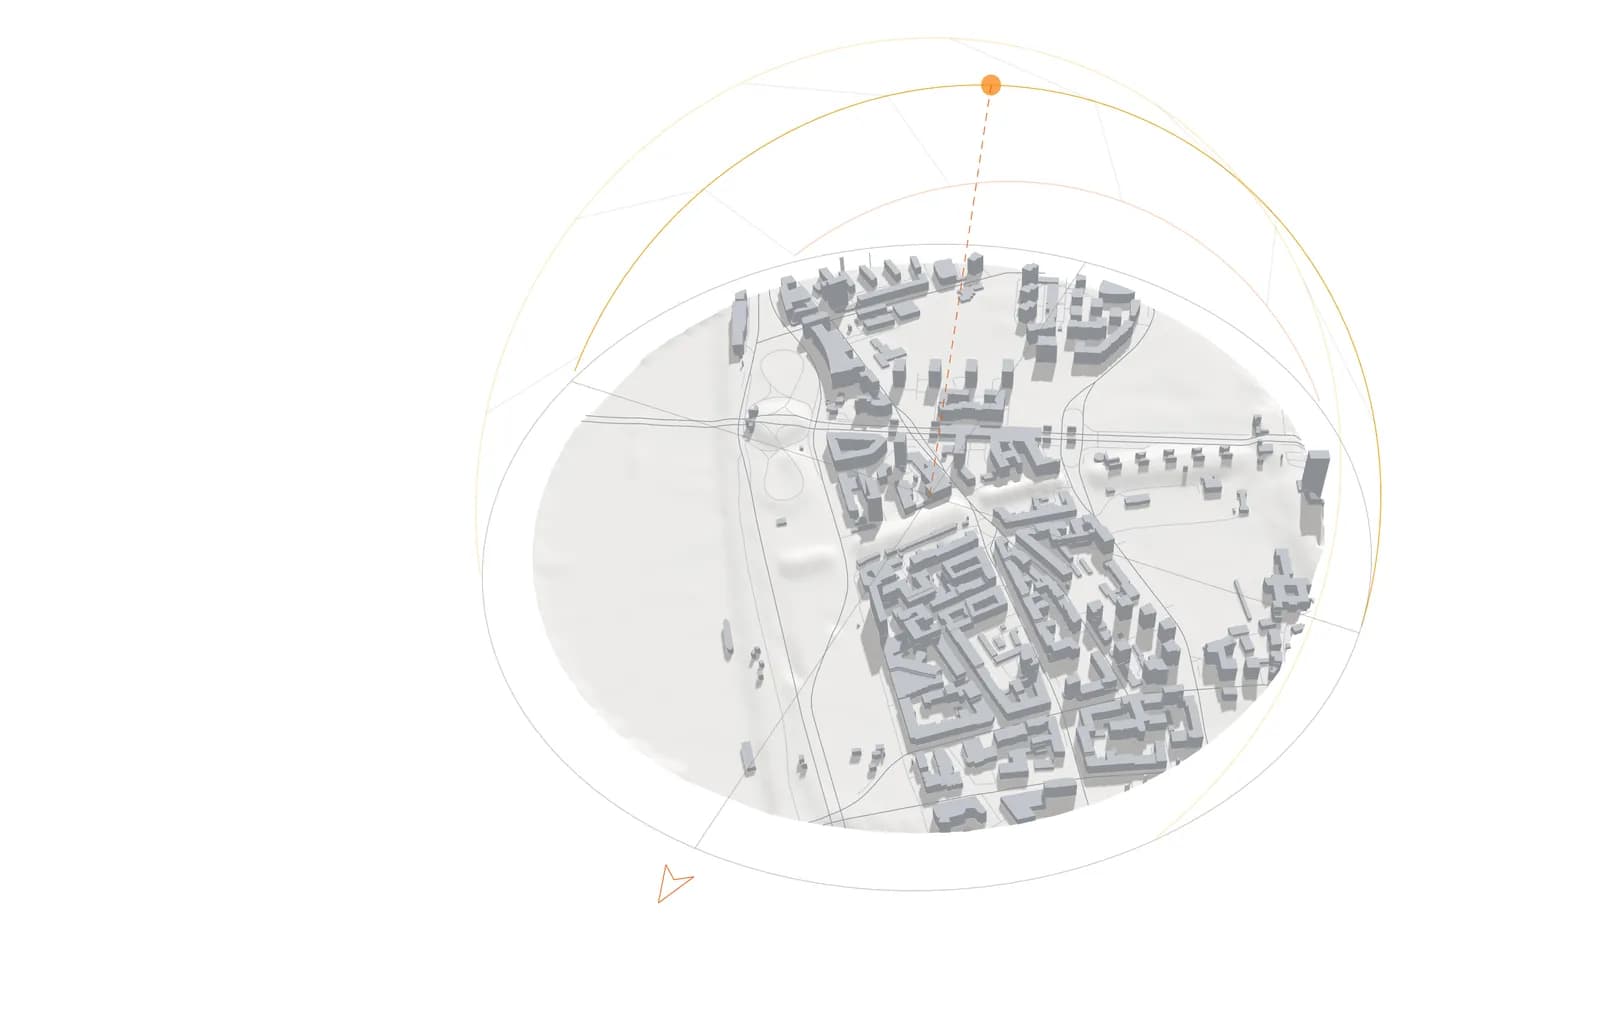
Export the hours you need for the board
Export one sheet per key hour. Shadows and the sun path are drawn into the PDF, PNG, DXF and SVG output, with the date and time printed on the sheet.
What you get
What you can put on the board
One study area gives the whole set, so a series of hours or dates stays consistent in scale and style.
- a series of shadow plans for the equinox and both solstices
- a sun path diagram in plan with the date and hour printed
- 3D views of the site with shadows for client meetings
- DXF and SVG with shadow outlines to refine in CAD or Illustrator
Frequently asked questions
Is this accurate enough for planning compliance?
It is meant for concept design: the sun position is calculated precisely, but building heights come from map data and the model has no windows or interiors. For a formal daylight or sunlight report, use a dedicated simulation tool with your own model.
Does the shadow study include my proposed building?
Yes. You can draw your own building outline with a height in the editor, and it casts shadows like the existing buildings, so you can compare massing options.
Which locations does Gridded cover?
Poland and the rest of Europe: 50 countries and territories, from Portugal and Ireland to Finland and Greece. Everywhere you get buildings, building use, roads, rail, public transport, water and greenery from OpenStreetMap, the 3D view and the sun study. Polish sites also use official national data: cadastral parcels, terrain, zoning plans, flood and noise maps, and building heights from the national surface model. The app tells you straight away whether a picked area is covered.
Does the sun study cost extra?
The Free plan gives 5 tokens every month. A study area up to 0.25 km² costs one token, up to 1 km² two tokens, and the largest area (about a 2 km radius) eight. Styling, presets, the 3D view and the sun study never cost extra. Free exports are vector PDF sheets with a small watermark. DXF, SVG and GeoJSON come with the Student and Solo plans, which open when the current free test period ends.
Related pages
Site analysis for architects: what to map, and how to get the maps in minutes.
A site analysis answers a short list of questions before design starts: what surrounds the plot, how people reach it, where the sun and the greenery are, what the neighbouring buildings are used for and what the rules allow. This checklist goes through each map, says where the data comes from in Europe and shows which maps Gridded makes from one generated study area.
A 3D model of the site's surroundings, from an address, in your browser.
Before a massing study you need the neighbours: how tall they are, how close they stand and what shadow they cast. Gridded builds a 3D context model from the same data as its 2D maps, so the site plan, the massing and the sun study always show the same buildings. It works for any address in 50 European countries.
Site analysis diagrams: twelve examples, what each one shows and when to use it.
A good site analysis is a small set of diagrams, each answering one question about the place. Below are twelve diagrams of the same study area in Kraków's Old Town, all generated in Gridded, so you can compare what each type reveals and pick the ones your project needs.